According to the Country Cassette research, the United Kingdom takes the 17th place in the top list of the highest-paying countries. An average employee gets $2,897.26 of net salary per month. Age is among the crucial factors influencing wages, as more experienced employees are paid more than youngsters. Furthermore, with age, the gender pay gap gradually increases. What is the average UK salary by age, and are there any strategies to augment the wage?
Table of Contents
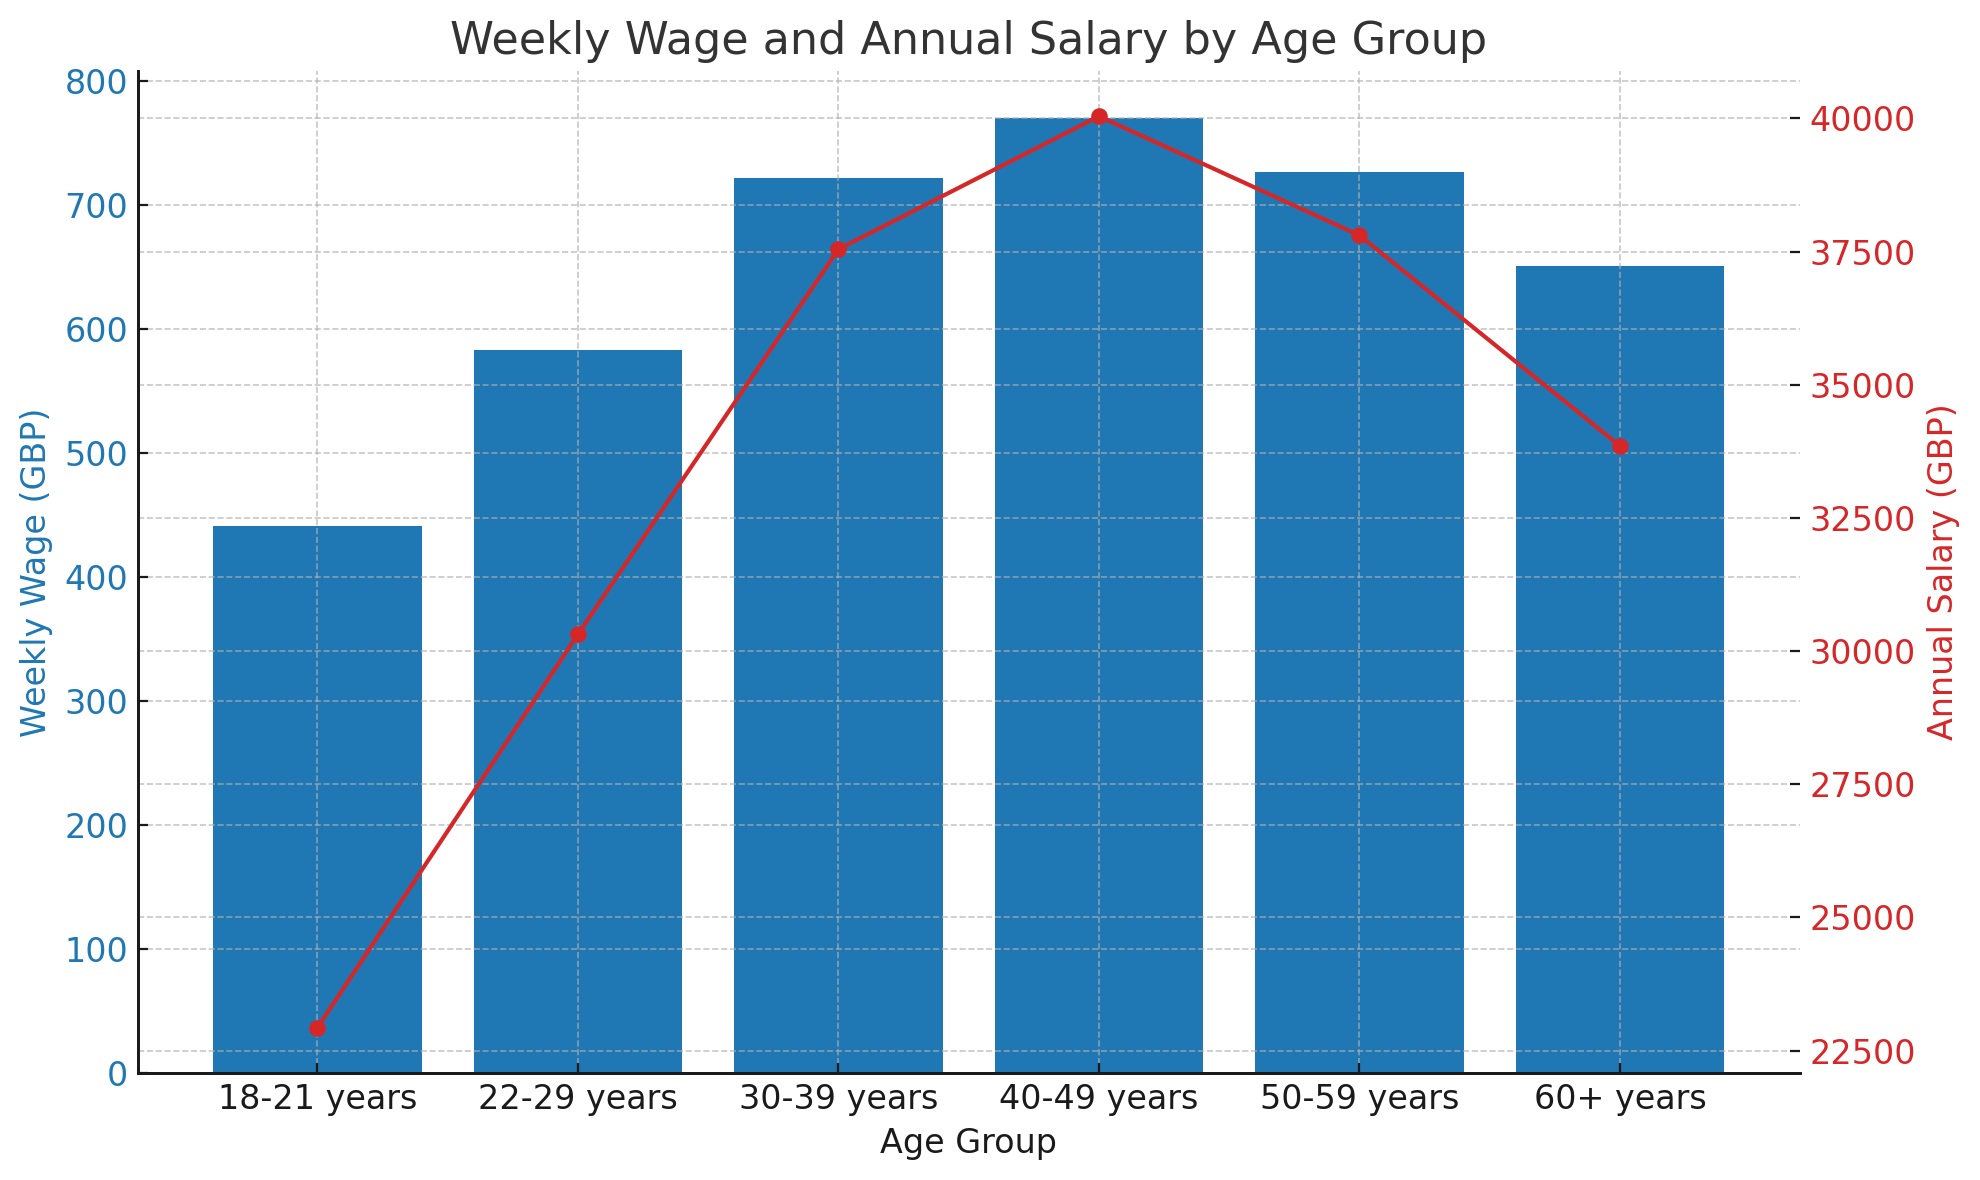
The ONS Annual Survey for Hours and Earnings stated that the age group from 40 to 49 years contains employees who get the highest average salaries – 40,040 GBP annually (£770 per week). The fullest distribution of average salaries by age looks as follows:
| Age group | Weekly wage (GBP) | Annual salary (GBP) |
| 18 – 21 years | 441 | 22,932 |
| 22 – 29 years | 583 | 30,316 |
| 30 – 39 years | 722 | 37,544 |
| 40 – 49 years | 770 | 40,040 |
| 50 – 59 years | 727 | 37,804 |
| 60+ years | 651 | 33,852 |
The given data reflects the median pay depending on certain age groups but doesn’t take into account other factors like gender, location, industry, etc. To understand the full picture, those numbers should be analyzed from diverse scopes.
Here are the interdependencies between age groups and other factors that influence average salaries in the United Kingdom:
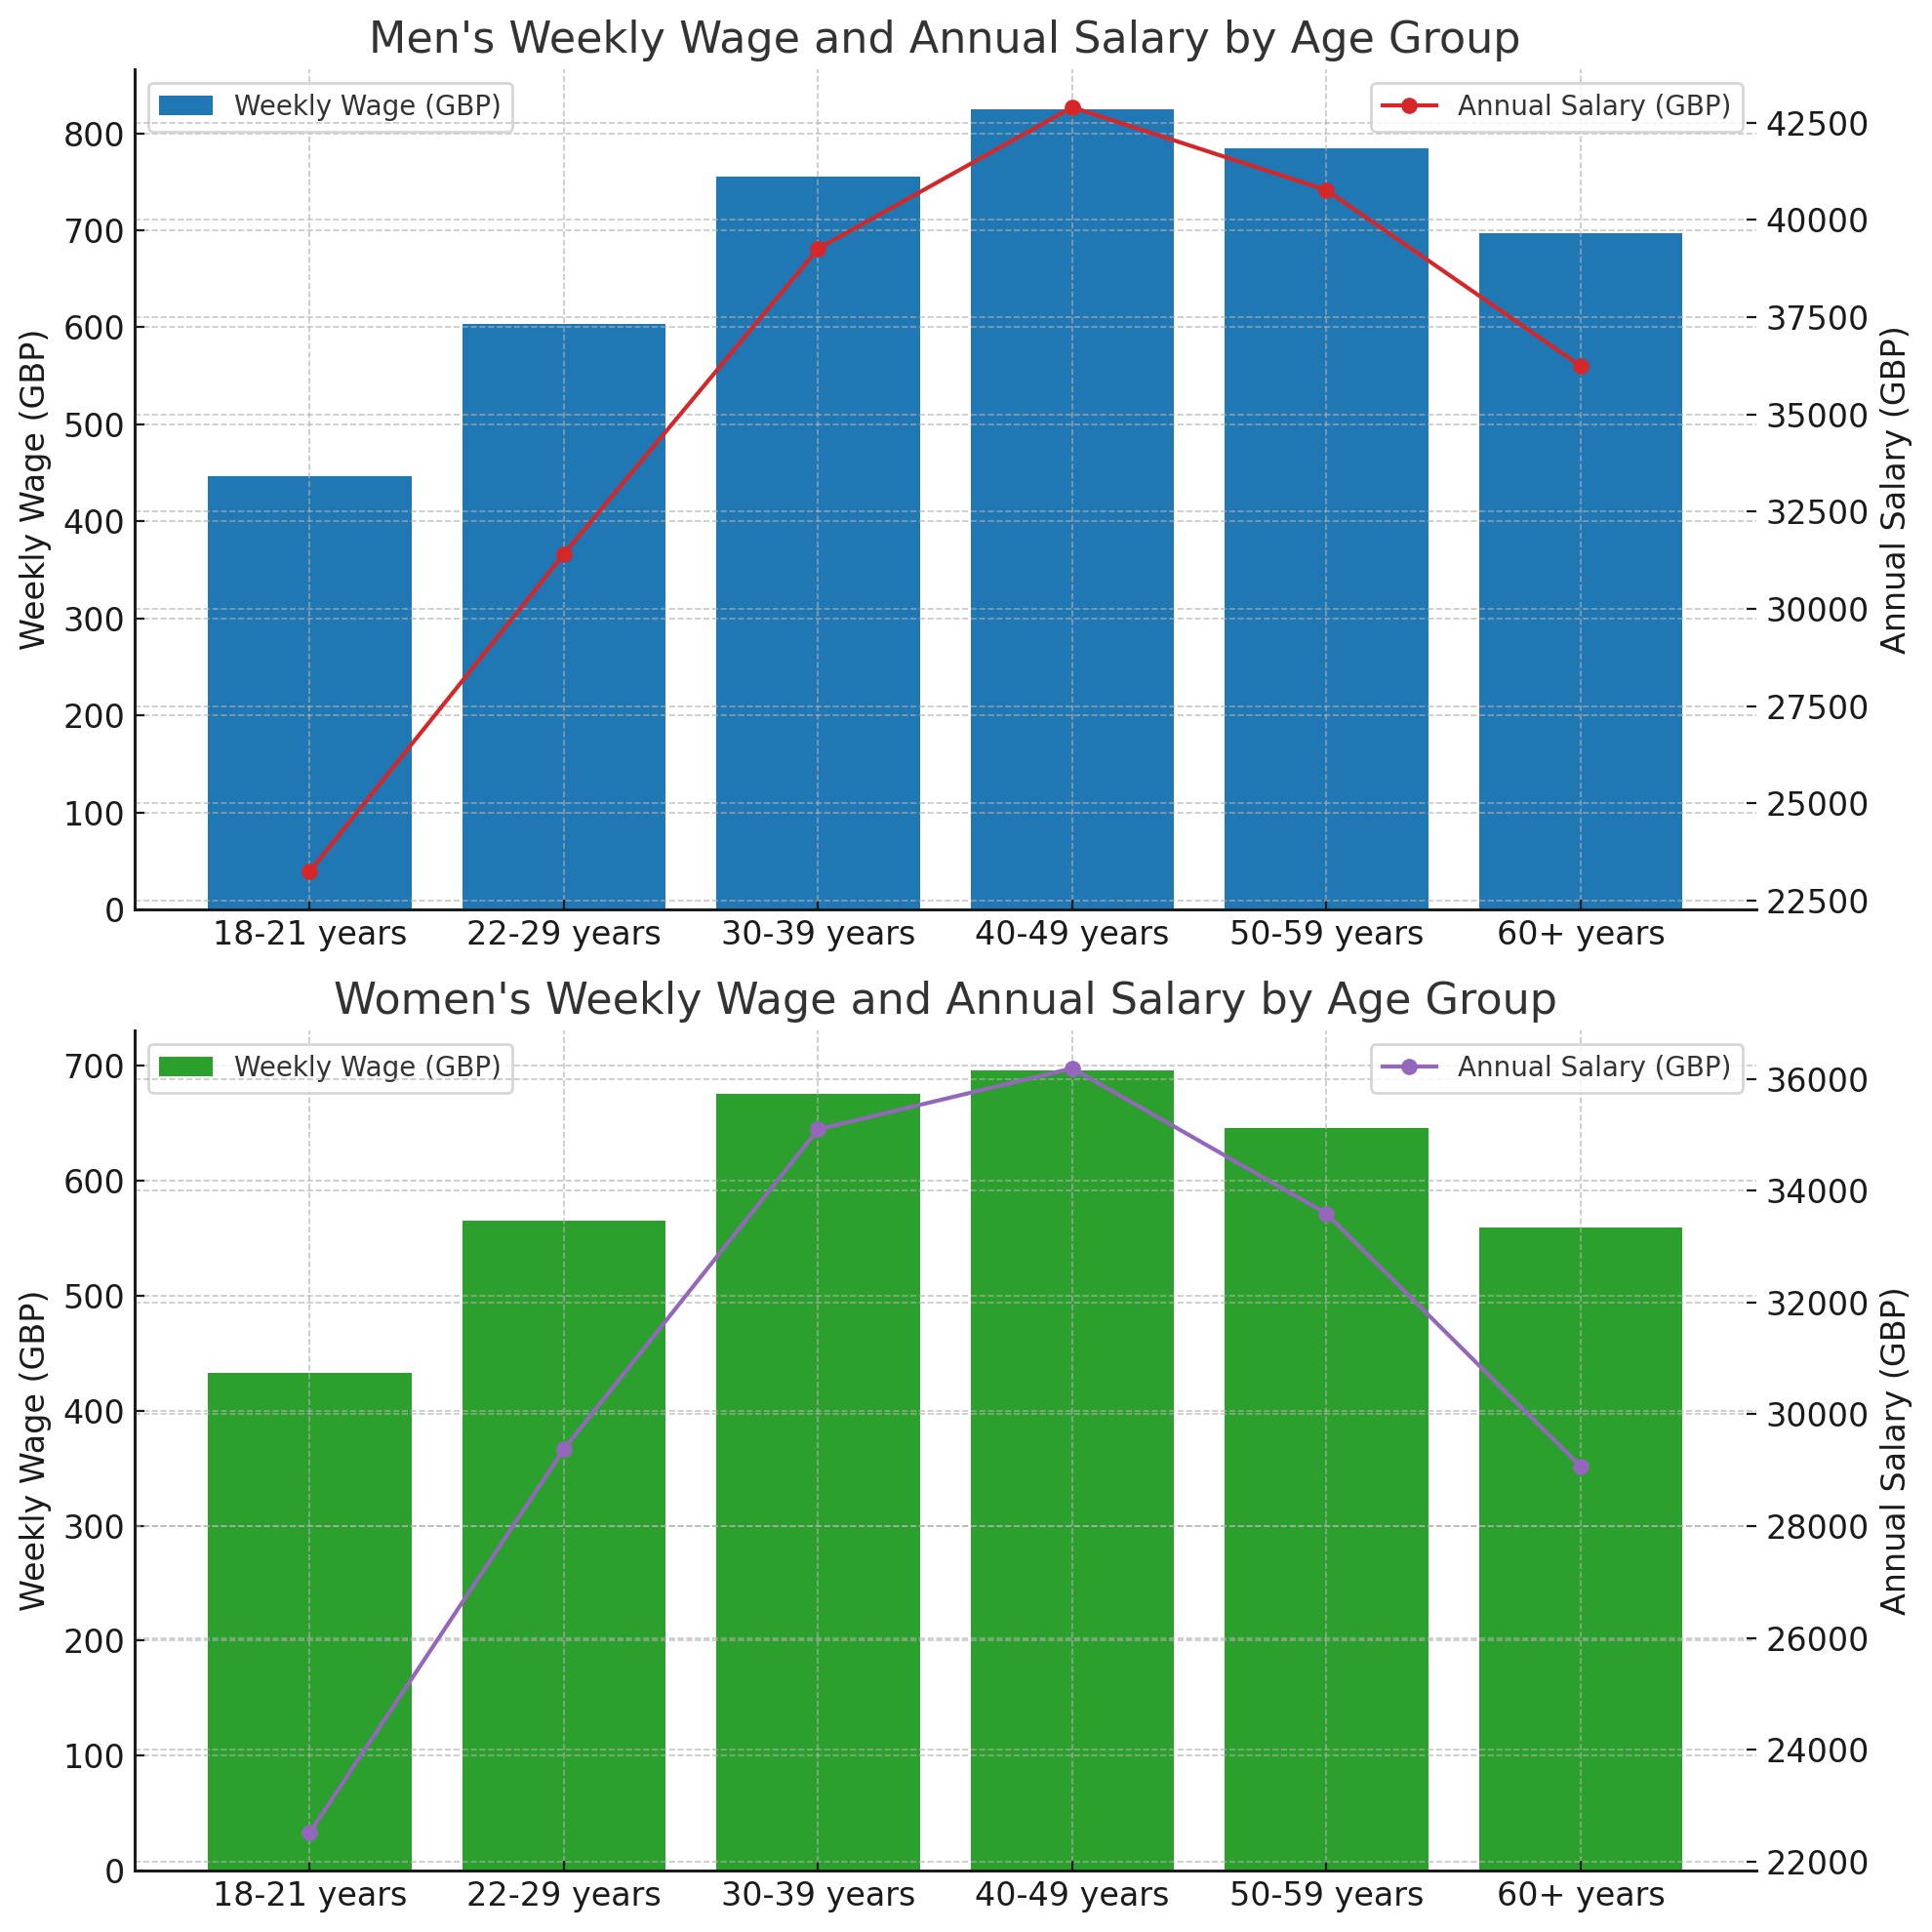
| Age group | Men (GBP) | Women (GBP) |
| 18 – 21 years | 23,244 (annually), 447 (weekly) | 22,516 (annually), 433 (weekly) |
| 22 – 29 years | 31,408 (annually), 604 (weekly) | 29,380 (annually), 565 (weekly) |
| 30 – 39 years | 39,260 (annually), 755 (weekly) | 35,100 (annually), 675 (weekly) |
| 40 – 49 years | 42,900 (annually), 825 (weekly) | 36,192 (annually), 696 (weekly) |
| 50 – 59 years | 40,768 (annually), 784 (weekly) | 33,592 (annually), 646 (weekly) |
| 60+ years | 36,244 (annually), 697 (weekly) | 29,068 (annually), 559 (weekly) |
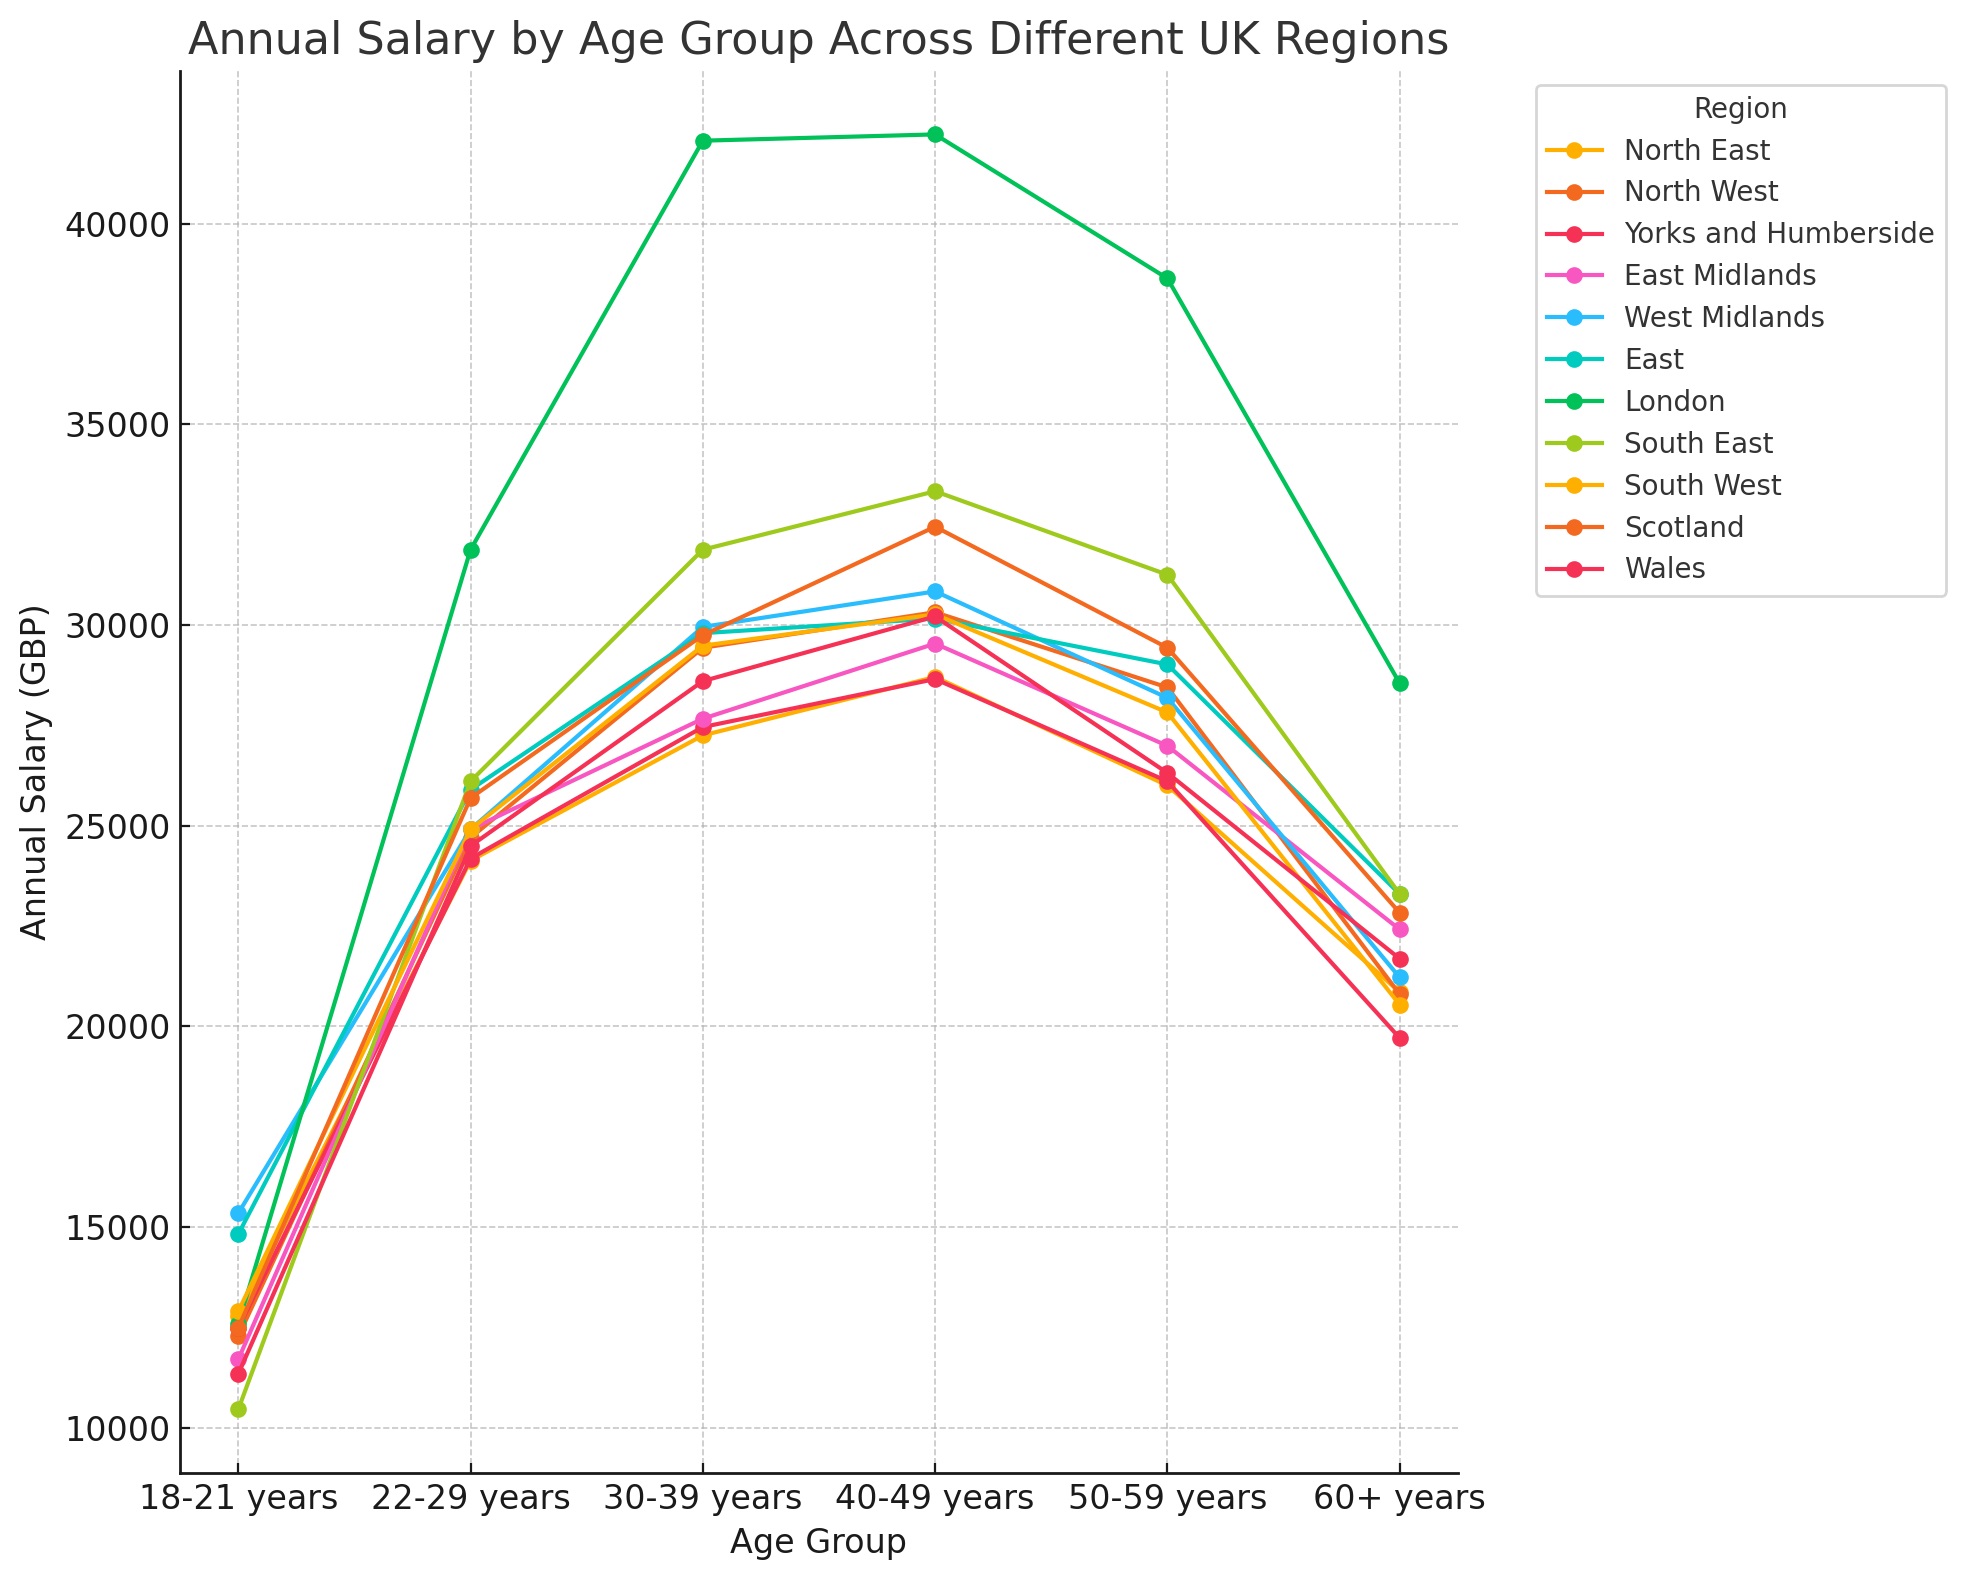
| Age group | 18 – 21 years (GDP) | 22 – 29 years (GDP) | 30 – 39 years (GDP) | 40 – 49 years (GDP) | 50 – 59 years (GDP) | 60+ years (GDP) |
| North East | 12,792 (annually), 246 (weekly) | 24,128 (annually), 464 (weekly) | 27,248 (annually), 524 (weekly) | 28,704 (annually), 552 (weekly) | 26,000 (annually), 500 (weekly) | 20,852 (annually), 401 (weekly) |
| North West | 12,272 (annually), 236 (weekly) | 24,700 (annually), 475 (weekly) | 29,432 (annually), 566 (weekly) | 30,316 (annually), 583 (weekly) | 28,444 (annually), 547 (weekly) | 20,800 (annually), 400 (weekly) |
| Yorks and Humberside | 12,480 (annually), 240 (weekly) | 24,180 (annually), 465 (weekly) | 27,456 (annually), 528 (weekly) | 28,652 (annually), 551 (weekly) | 26,104 (annually), 502 (weekly) | 19,708 (annually), 379 (weekly) |
| East Midlands | 11,700 (annually), 225 (weekly) | 24,908 (annually), 479 (weekly) | 27,664 (annually), 532 (weekly) | 29,536 (annually), 568 (weekly) | 26,988 (annually), 519 (weekly) | 22,412 (annually), 431 (weekly) |
| West Midlands | 15,340 (annually), 295 (weekly) | 24,908 (annually), 479 (weekly) | 29,952 (annually), 576 (weekly) | 30,836 (annually), 593 (weekly) | 28,184 (annually), 542 (weekly) | 21,216 (annually), 408 (weekly) |
| East | 14,820 (annually), 285 (weekly) | 25,896 (annually), 498 (weekly) | 29,796 (annually), 573 (weekly) | 30,160 (annually), 580 (weekly) | 29,016 (annually), 558 (weekly) | 23,296 (annually), 448 (weekly) |
| London | 12,584 (annually), 242 (weekly) | 31,876 (annually), 613 (weekly) | 42,068 (annually), 809 (weekly) | 42,224 (annually), 812 (weekly) | 38,636 (annually), 743 (weekly) | 28,548 (annually), 549 (weekly) |
| South East | 10,452 (annually), 201 (weekly) | 26,104 (annually), 502 (weekly) | 31,876 (annually), 613 (weekly) | 33,332 (annually), 641 (weekly) | 31,252 (annually), 601 (weekly) | 23,296 (annually), 448 (weekly) |
| South West | 12,896 (annually), 248 (weekly) | 24,908 (annually), 479 (weekly) | 29,484 (annually), 567 (weekly) | 30,264 (annually), 582 (weekly) | 27,820 (annually), 535 (weekly) | 20,540 (annually), 395 (weekly) |
| Scotland | 12,480 (annually), 240 (weekly) | 25,688 (annually), 494 (weekly) | 29,744 (annually), 572 (weekly) | 32,448 (annually), 624 (weekly) | 29,432 (annually), 566 (weekly) | 22,828 (annually), 439 (weekly) |
| Wales | 11,336 (annually), 218 (weekly) | 24,492 (annually), 471 (weekly) | 28,600 (annually), 550 (weekly) | 30,212 (annually), 581 (weekly) | 26,312 (annually), 506 (weekly) | 21,684 (annually), 417 (weekly) |
| Age group | 18 – 21 years (GDP) | 22 – 29 years (GDP) | 30 – 39 years (GDP) | 40 – 49 years (GDP) | 50 – 59 years (GDP) | 60+ years (GDP) |
| Travel sector | 10,036 (annually), 193 (weekly) | 20,488 (annually), 394 (weekly) | 19,500 (annually), 375 (weekly) | 21,840 (annually), 420 (weekly) | 20,852 (annually), 401 (weekly) | 17,108 (annually), 329 (weekly) |
| Education | – | 33,176 (annually), 638 (weekly) | 40,924 (annually), 787 (weekly) | 43,524 (annually), 837 (weekly) | 43,212 (annually), 831 (weekly) | 28,444 (annually), 547 (weekly) |
| Healthcare | 18,824 (annually), 362 (weekly) | 33,228 (annually), 639 (weekly) | 37,700 (annually), 725 (weekly) | 37,700 (annually), 725 (weekly) | 37,544 (annually), 722 (weekly) | 28,028 (annually), 539 (weekly) |
| Transport | 17,056 (annually), 328 (weekly) | 26,832 (annually), 516 (weekly) | 29,588 (annually), 569 (weekly) | 30,472 (annually), 586 (weekly) | 29,432 (annually), 566 (weekly) | 29,432 (annually), 566 (weekly) |
| Administration | 20,384 (annually), 392 (weekly) | 24,752 (annually), 476 (weekly) | 24,908 (annually), 479 (weekly) | 24,908 (annually), 479 (weekly) | 24,024 (annually), 462 (weekly) | 20,436 (annually), 393 (weekly) |
| Sales and customer service | 8,320 (annually), 160 (weekly) | 18,304 (annually), 352 (weekly) | 18,824 (annually), 362 (weekly) | 17,992 (annually), 346 (weekly) | 16,328 (annually), 314 (weekly) | 12,636 (annually), 243 (weekly) |
| Management | 25,064 (annually), 482 (weekly) | 33,436 (annually), 643 (weekly) | 43,836 (annually), 843 (weekly) | 50,128 (annually), 964 (weekly) | 49,660 (annually), 955 (weekly) | 37,856 (annually), 728 (weekly) |
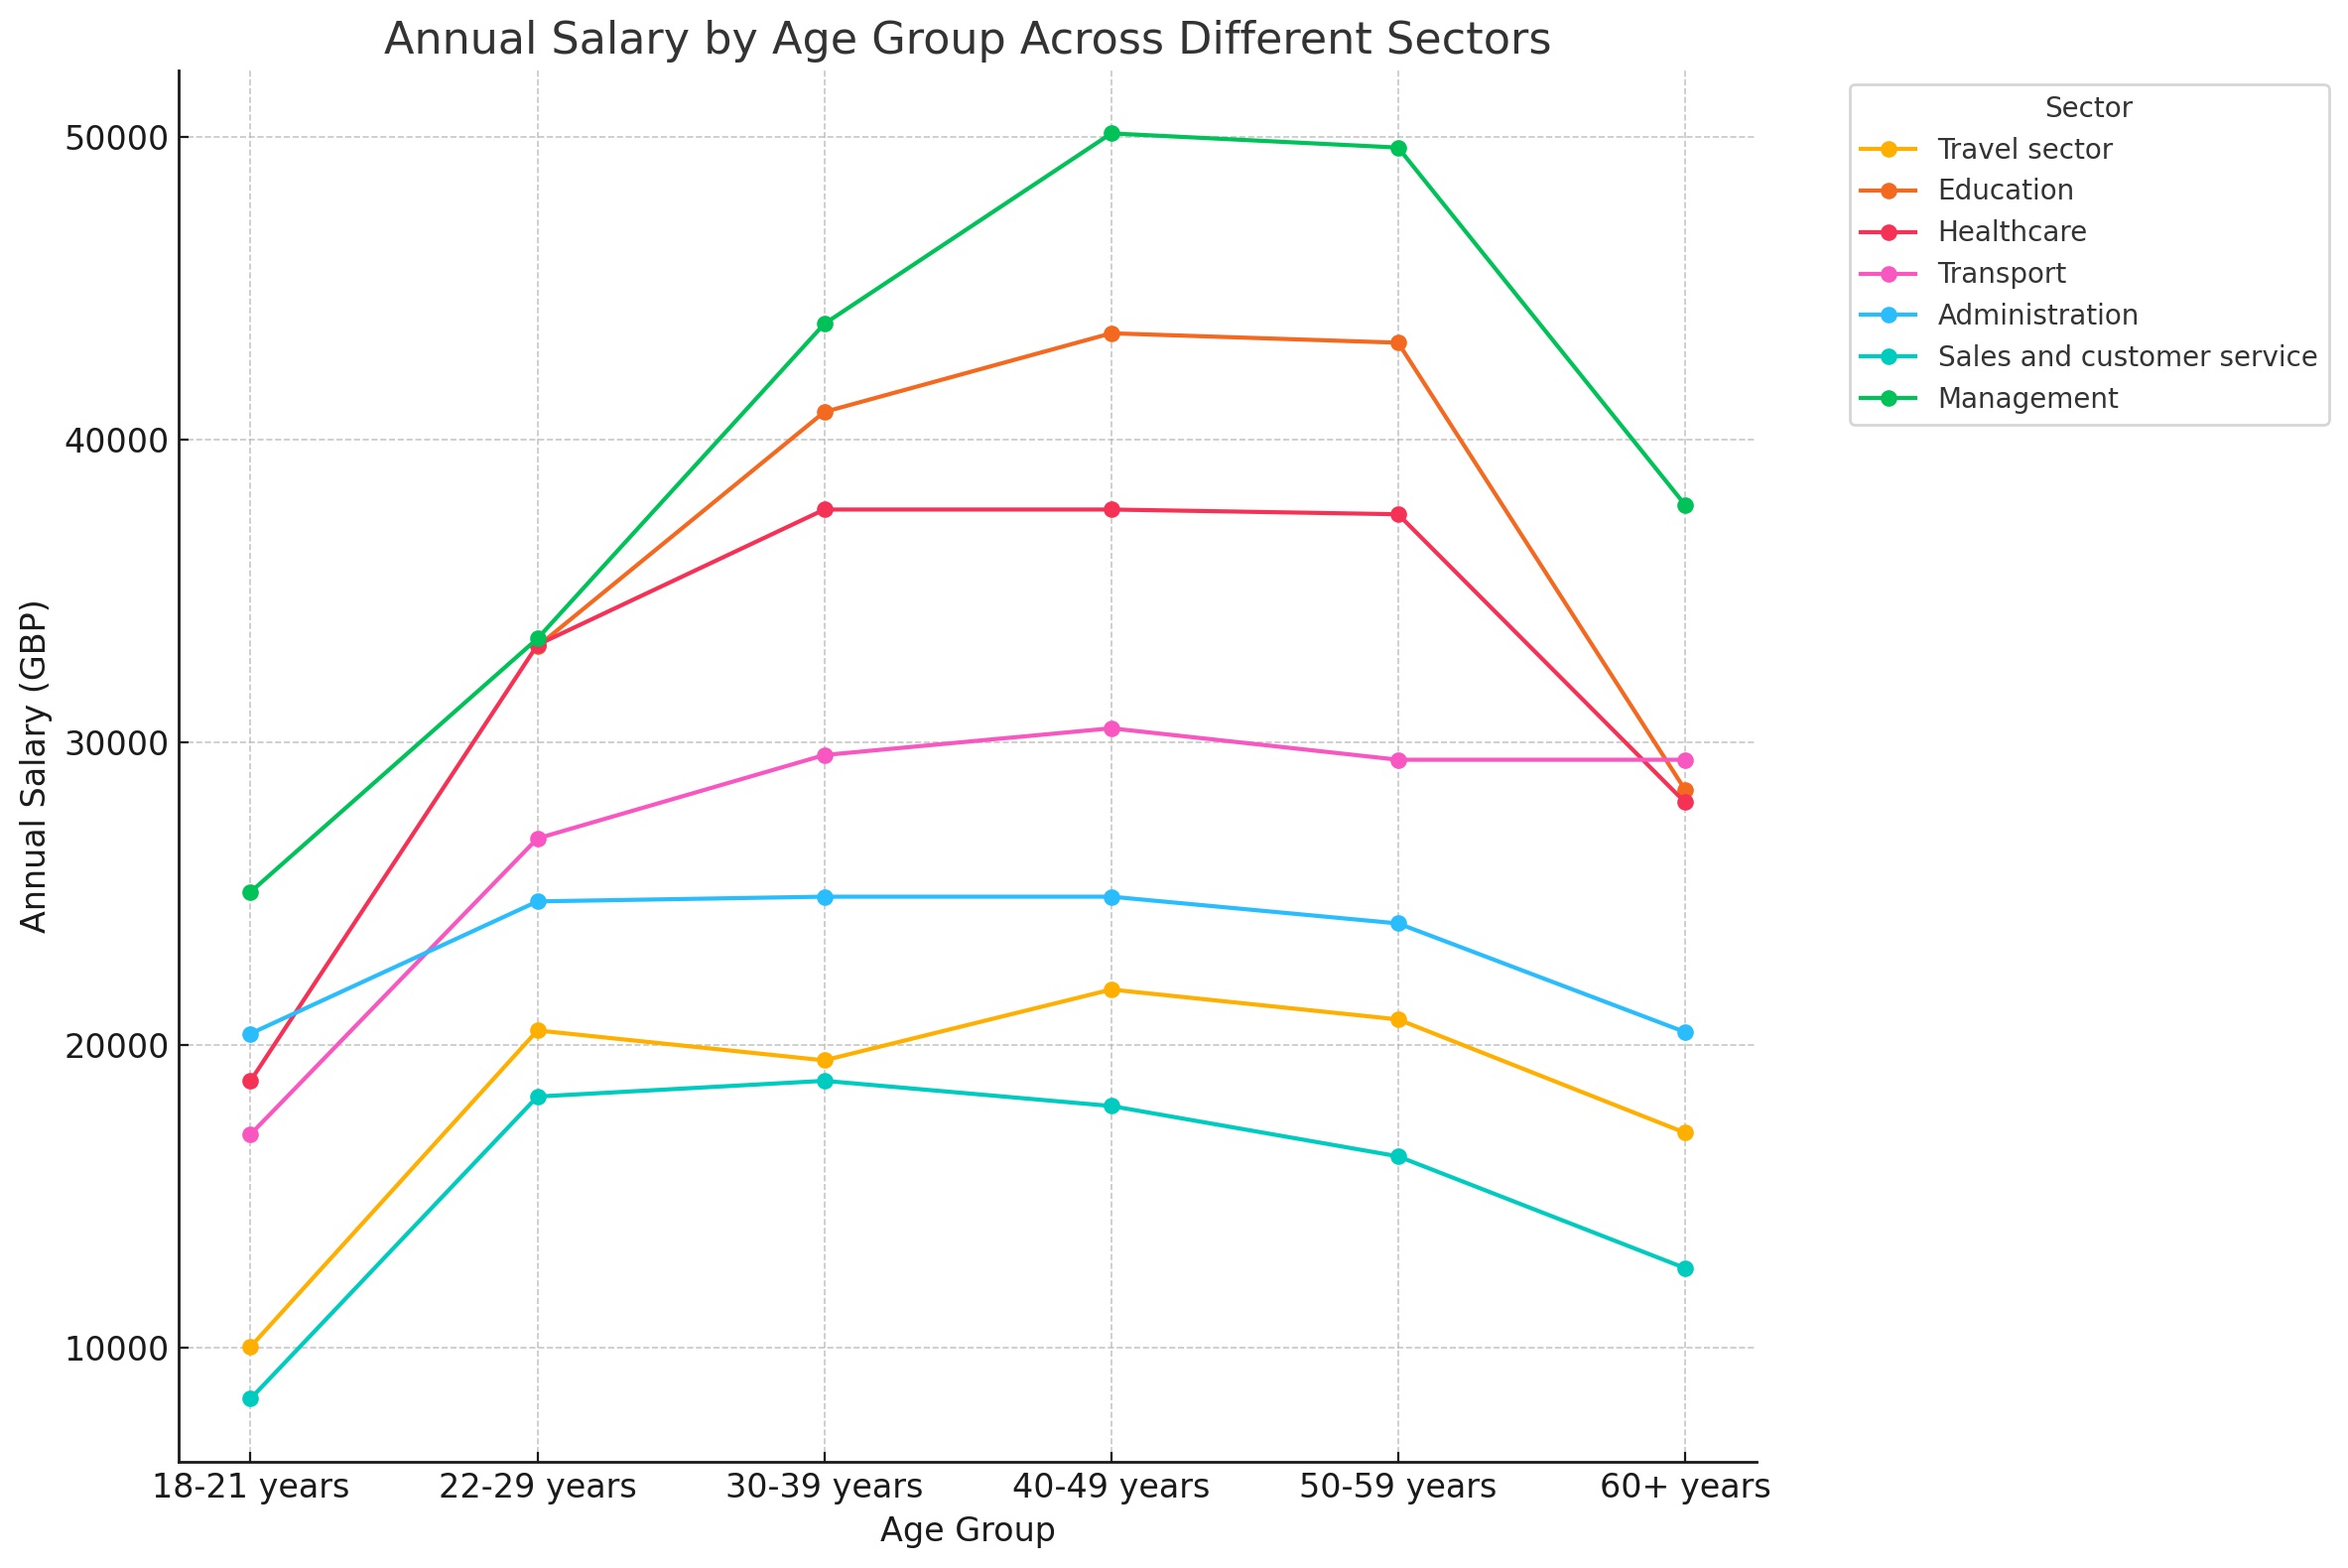
Based on the stated statistics, we conclude that other factors like location and industry affect the average salary in the United Kingdom even more than age.
The 18 – 21 age group is the least paid in the UK. Inexperienced employees with no or basic education and the lowest skill level get the lowest average salaries. Depending on the industry, representatives of this age group may earn from £193 to £482 per week. Furthermore, some industries are unavailable for employees aged between 18 and 21 (e.g., education).
British employees get higher salaries alongside increasing their education levels and experience. From the age of 22 to the late 40s, specialists usually see their wages gradually rising. According to statistics, employers aged between 40 and 49 years are recognized as the most experienced and qualified specialists, so they get the highest salaries.
Hence, the median pay rises during the period linked with most career advancements. Workers upgrade their skills, get promotions, change their positions, etc. When a person hits 50, they have crossed the professional equator as further wages typically decrease.
In recent years, the average earnings of a person aged between 40 and 49 years is 74.6% higher than youngsters under 21. After 60 years, workers receive 15.5% lower than their career picks.
Location is the next important factor affecting the median pay in Great Britain. London offers the highest salaries for all age groups, with the exception of employees aged 18 to 21. Youngsters are paid the most in the West Midlands.
South East and Wales are the worst locations for inexperienced earners. The average salary of ‘newcomers’ ranges from £201 to £218. The best places for young workers are East and West Midlands, with the average pay from £285 to £295.
For earners between 22 and 29 years, most regions offer more or less equal salaries. The weekly median pay varies from £464 to £479 in North East, North West, Yorks and Humberside, East Midlands, West Midlands, South West, and Wales. Higher wages are offered in London (£613), South East (£502), East (£498), and Scotland (£494). The same situation is observed for age groups 30-39 years and 40-49 years: four regions offer better conditions than the rest of the kingdom.
For employees aged between 50 and 59 (the first age group where average salaries commence to decline), London offers the highest wages (£743 per week). West Midlands, North West, East, Scotland, and South East pay from £542 to £601 weekly, while North East, Yorks and Humberside, Wales, and East Midlands may offer the lowest salaries (from £500 to £519 per week).
When talking about senior workers (60+), their wages differ from £379 (Yorks and Humberside) to £448 (South East) per week. The stats exclude London where aged employees get £549 weekly.
The pay gap is still a problem when analyzing UK salaries of men and women. According to the governmental report, the UK average gender pay gap reached 14.3% in 2023 (0.6% higher than in 2022). The United Kingdom occupies the 15th position in the pay equity ranking. Meanwhile, the numbers are still high enough to understand the gender pay gap as a problem.
At the same time, the gender factor plays different roles attached to different age groups. What does it mean? The national statistics don’t take into account the gap distribution by age. For instance, younger male workers get average earnings of £447 per week (£23,244 annually). Female employees between 18 and 21 years are paid £433 weekly (£22,516 annually). The difference is £14 per week or 3.132% (almost 10% lower than the average gap index in the UK).
Within other age groups, the gap continues to grow. Female earners between 22 and 29 years get 6.457% smaller salaries than males of the same age. For workers aged 30-39 years, the gap is 10.6%. The highest-paid age group between 30 and 39 years experiences a gap of 15.63%.
After the career equators, the gender pay gap still increases: female employees of 50-59 years receive 17.6% less than male workers, and 60+ women get median earnings that are 19.8% lower than senior male workers’.
Hence, the gap problem is almost invisible for youngsters who earn minimum wage. When talking about chief executives and very senior and highly paid posts, the total number of female employees is significantly lower than the number of male workers in roles.
The earning potential of a ‘newcomer’ consists of the following parts:
Based on the mentioned components of earning potential, one can build an effective strategy to get the highest-paid jobs.
Which steps are effective enough to maximize the average salary?
In the UK, youngsters aged between 18 and 21 get the lowest salaries. Median wages grow gradually till 49 together with the growth of the education level, skills, and experience. The gender pay gap is among the most important problems as the median pay for male and female workers differ by 3.13% – 19.8%. As for the ways to increase average earnings, the most effective ones lie in getting higher education, upgrading professional skills, diving into innovations and the latest technologies, and changing location.
Country Cassette
ONS Annual Survey for Hours and Earnings
2023 gender pay gap report
Global Gender Gaps, 2023